Giving Teachers
a Voice Back
How do you design for people who are too burned out to trust that feedback will ever lead to change?
"Give me preliminary tips first. I need to know this is worth my time before I wait."
Teachers had data.
Nobody told them what to do with it.
EdTechLive had a survey methodology and a working product. But burnt-out teachers weren't adding another tool to their workflow. Our question: why would they? 8 interviews and a competitive audit gave us the answer.
10 competitors. None closed the loop with teachers.
Two camps: survey-to-report tools (serving admins) and interactive assessment platforms (serving districts). Neither translated data into something a teacher could act on tomorrow.
 Tripod
 Resonant
Panorama
Youth Truth
Resonant
Panorama
Youth Truth
Data aggregated at school/district level. Teachers receive reports, not guidance.
Rich data collection, but professional development lives in a separate silo, never tied to daily teaching.
Not a data problem.
A support problem.
8 interviews: 5 teachers, 3 administrators. Teachers weren't struggling with curriculum; they were drowning in anonymous negative feedback with no context and no next step. Affinity mapping revealed a clean split: admins wanted monitoring, educators wanted one actionable thing they could try tomorrow.
- Track performance across classes and schools
- Formal feedback pipelines that scale
- District-level engagement visibility
- One fast, practical tip — not a 40-page report
- Context for why students gave that feedback
- Progress that's visible across the school year
- Negative anonymous feedback felt like an attack
- No tool helped interpret student frustration
- Teachers disengage when follow-through isn't visible
"Educators touch the platform daily. If we nail the educator layer first, the admin view becomes meaningful — not the other way around."
→ Journey scoped to 4 stages: Onboarding → Collecting → Receiving Tips → Integrating
→ Admin dashboard deferred to next iteration
Four features,
each earned through research.
3 rounds of wireframes → mid-fidelity prototype. Every feature traces directly to a specific user pain point.
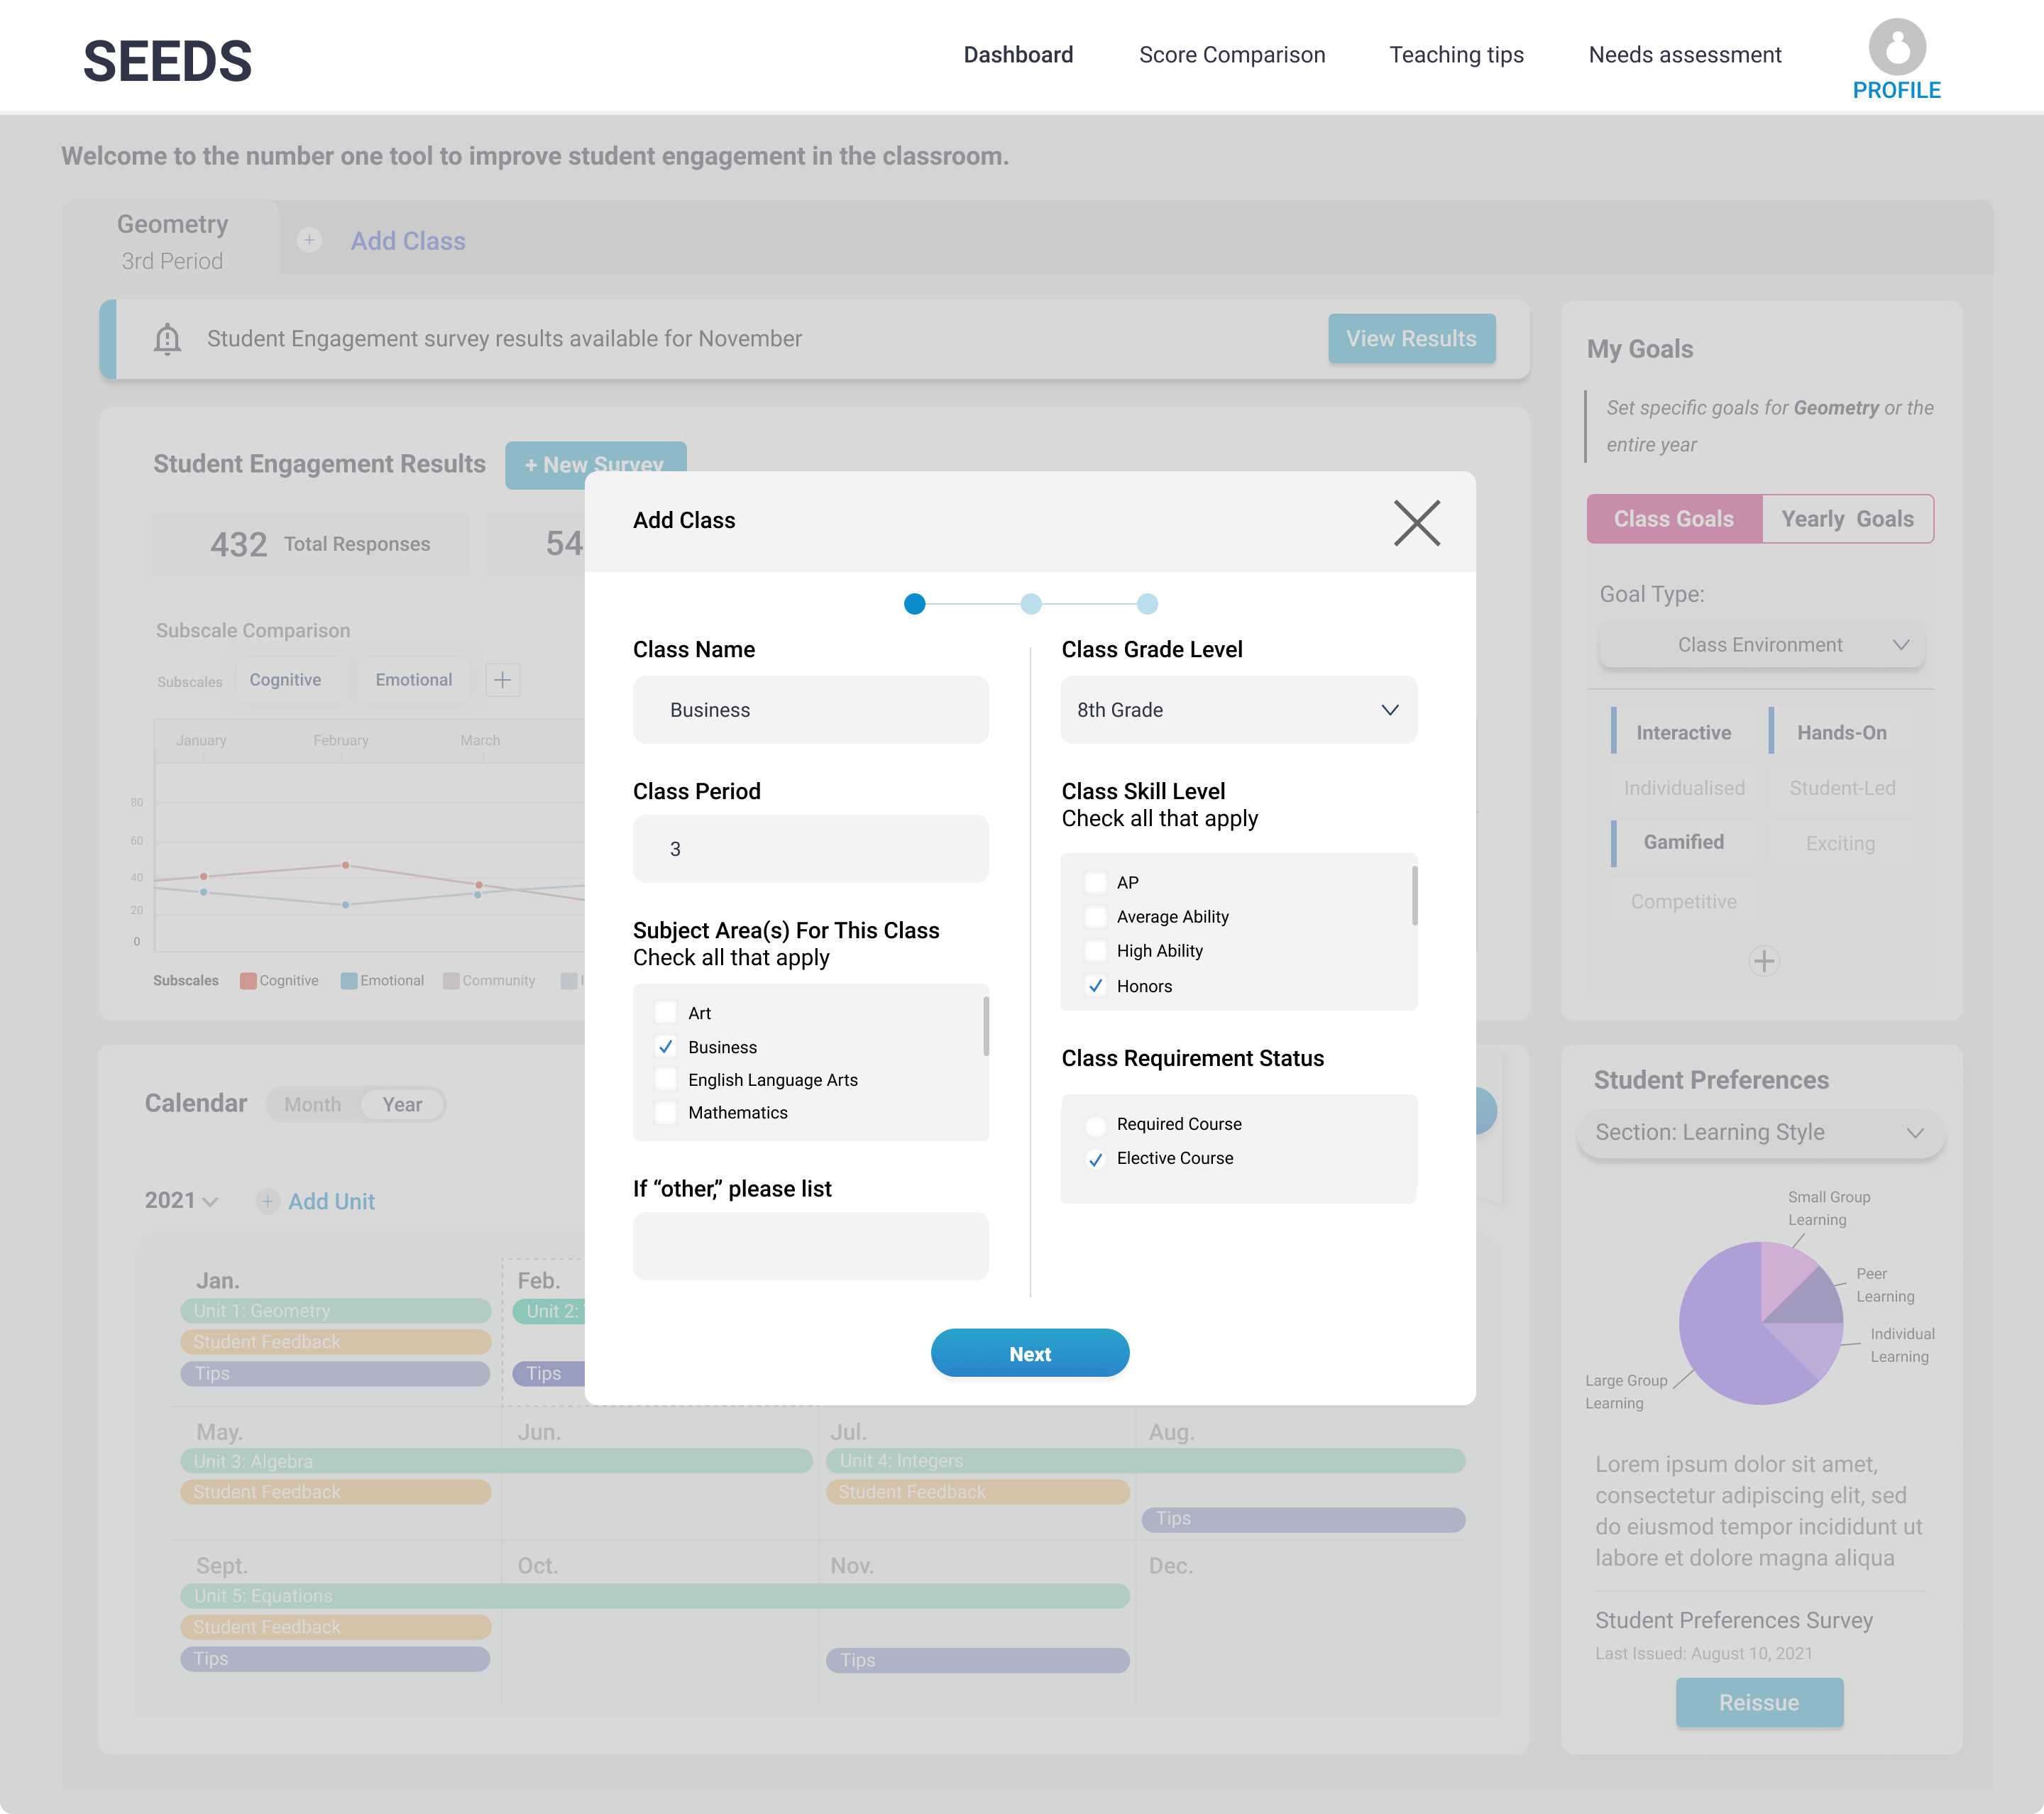
Tab-based class switching surfaces the right data in context: no hunting, no lost thread between periods.
Match the mental model teachers already use. Reduce cognitive load at exactly the moment they're most pressed.
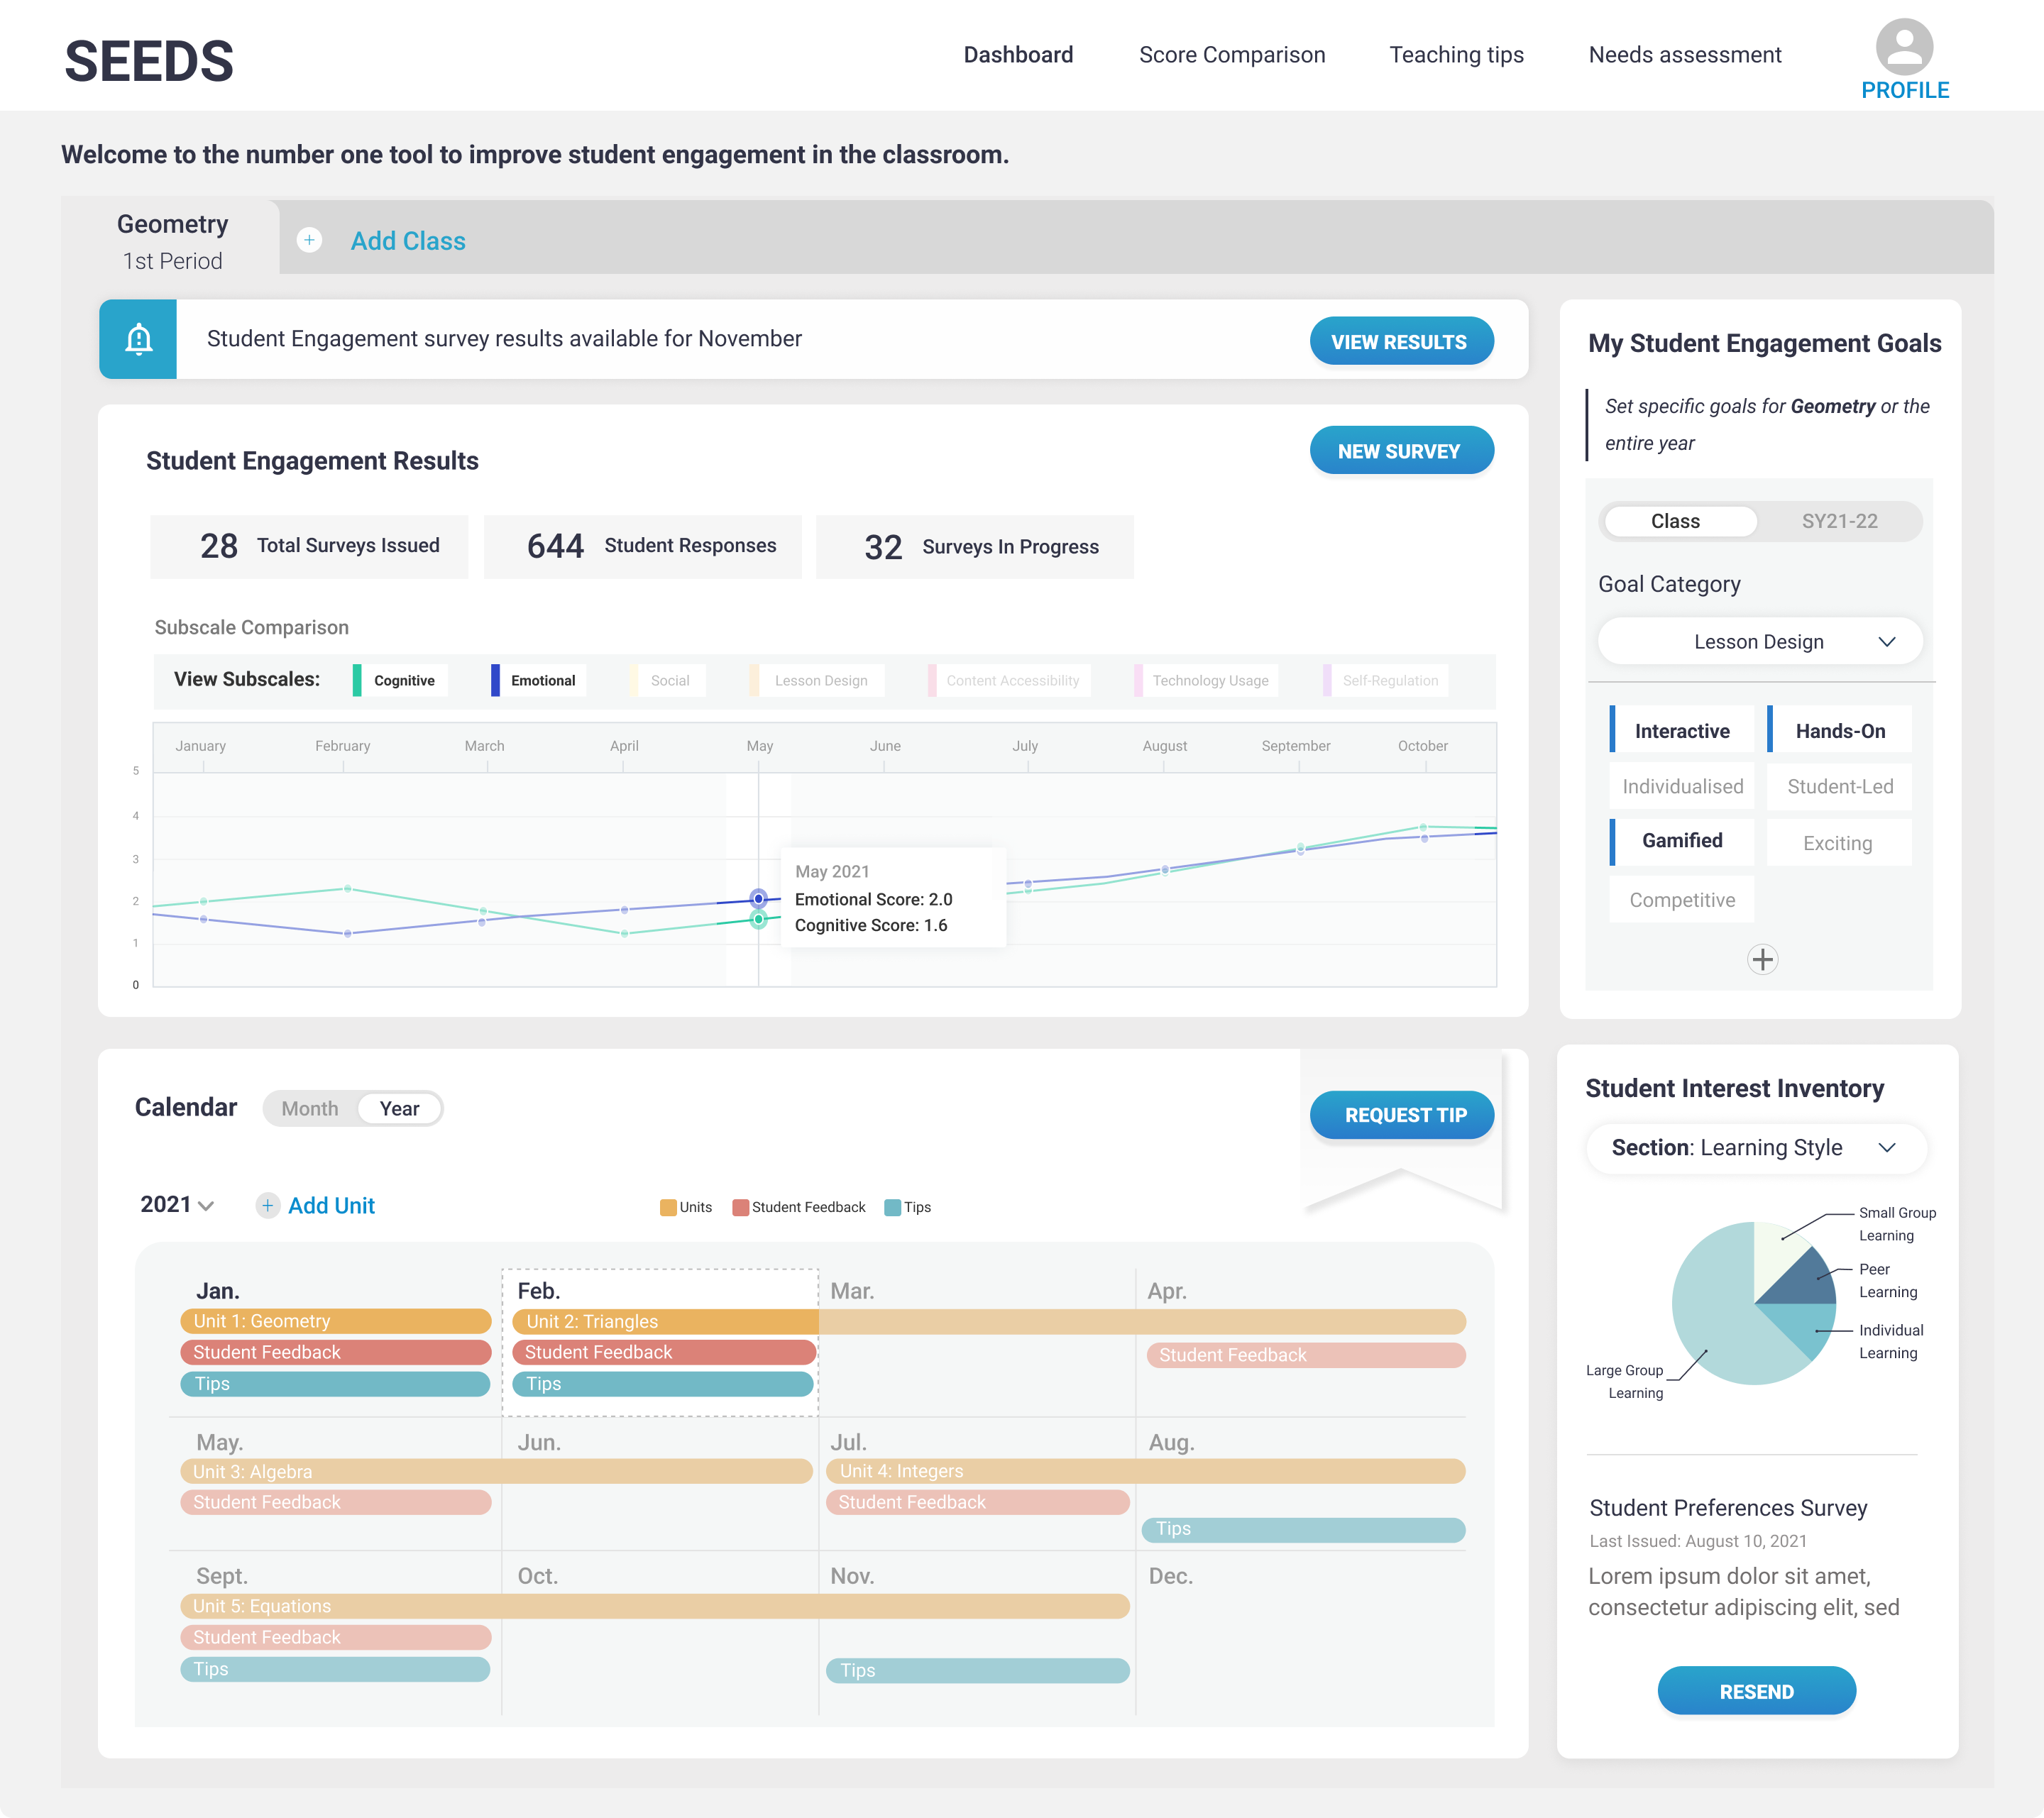 Dashboard · Tab System
"Request a Tip" embedded directly in the calendar, tied to specific lessons. The client later promoted it to primary CTA; we'd found the right trigger point.
Pending tips create an open loop that brings teachers back. Lesson planning is the moment of highest motivation.
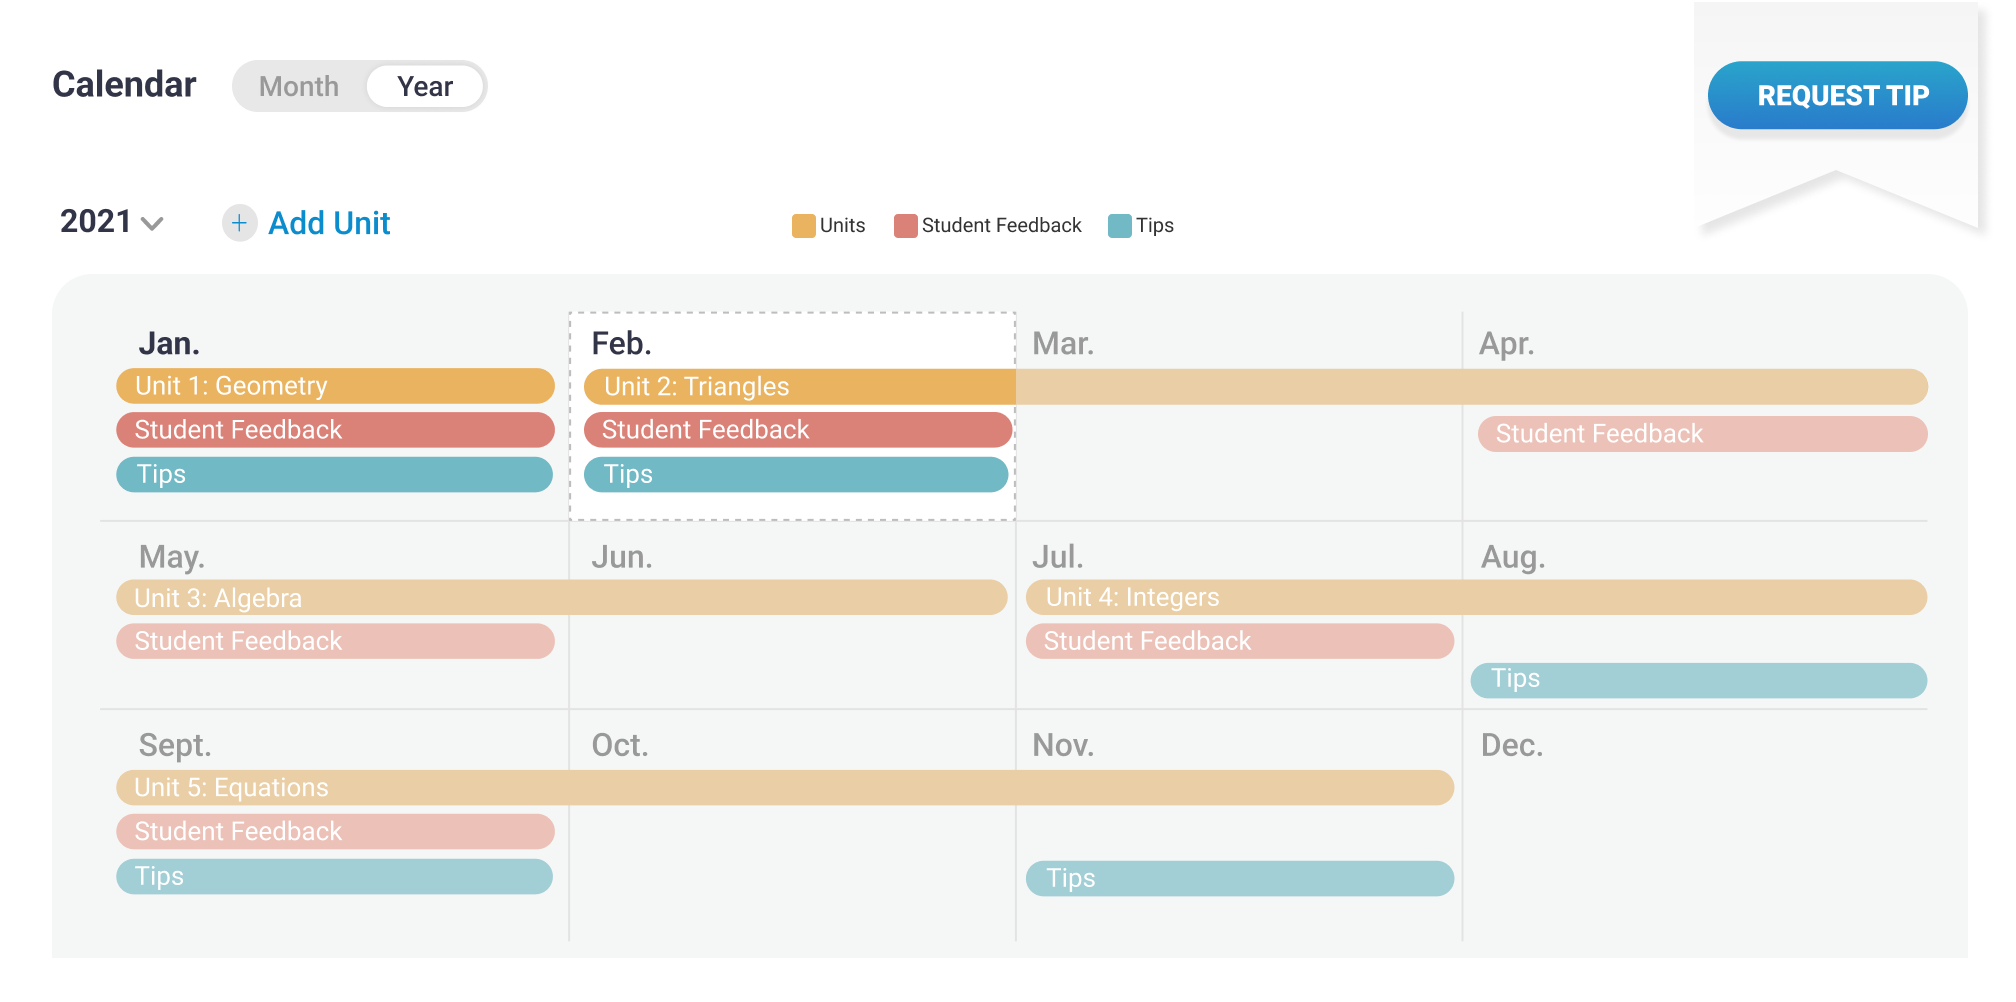 Calendar · Tip Integration
A persistent goals module, categorized by domain, visible to both teacher and administrator year-round, anchoring tips and feedback to something that matters long-term.
Progress feels real when the finish line is visible. Categorical chunking makes complex goals approachable.
 Engagement → Goal Setting
Learning styles shown as a chart, not a raw list. One copy change surfaced in testing: "UPDATE" → "RESEND" implied the survey had actually gone somewhere. Confusion dropped immediately.
Patterns at a glance beat categories to memorize. The goal link closes data → action in one view.
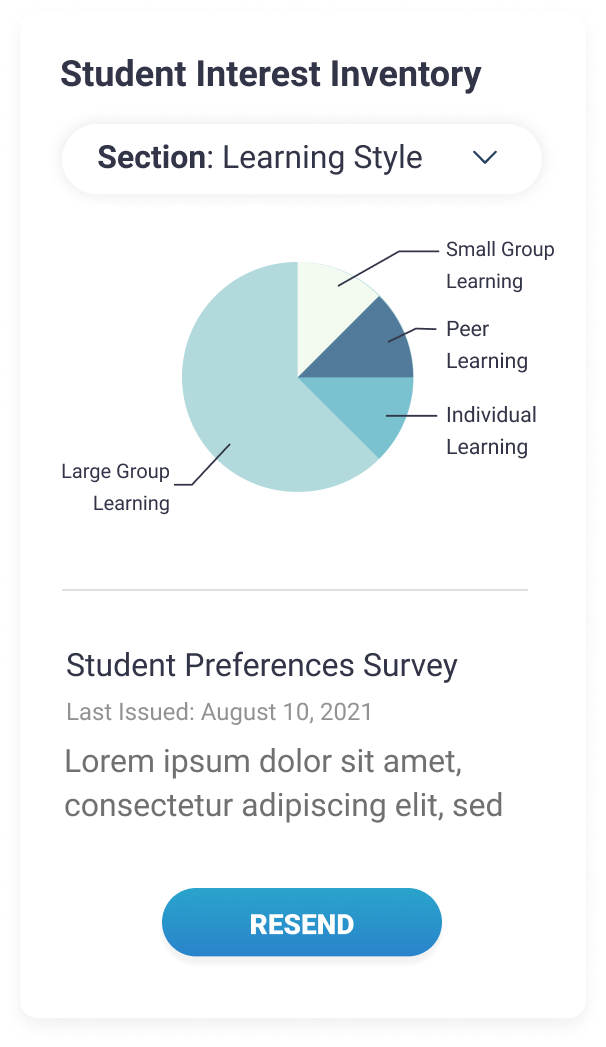 Student Inventory · Preferences
Halfway there.
Testing showed us the other half.
3 sessions · 6 tasks each · mid-fidelity prototype. The calendar we were proud of failed. The tip flow needed rethinking. Both got fixed.
"The calendar is confusing. I'm used to a standard monthly view."
"Give me a quick tip first. I need to know it's worth waiting for the full one."
What I'd tell myself
on day one.
This shipped. It went live. Every decision traces back to something a real person told us. The brief said "survey platform." Research said "teacher confidence." Those aren't the same product; knowing the difference is the job.